nuttx需要单步调试的话需要打开两个配置项,编译出来才会带符号表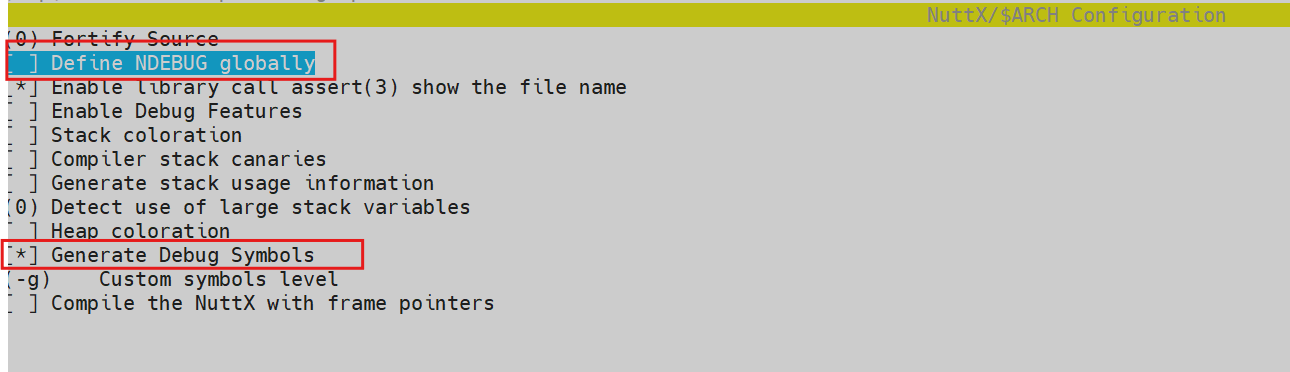
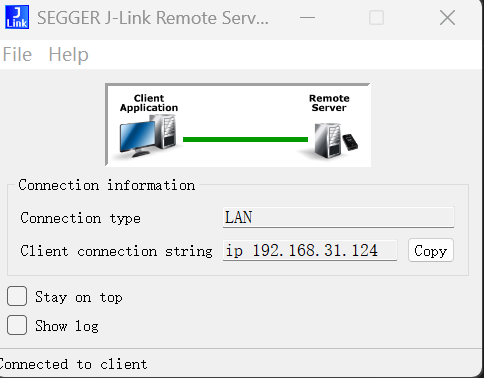
我是在wsl2中配置的环境,使用jlink来进行调试。
主机环境先打开jlink remote server
wsl中使用如下命令即可和jlink连接,并进行烧录操作。
1
JLinkExe -device STM32F411CE -ip 192.168.31.124 -if SWD -speed 4000 -autoconnect
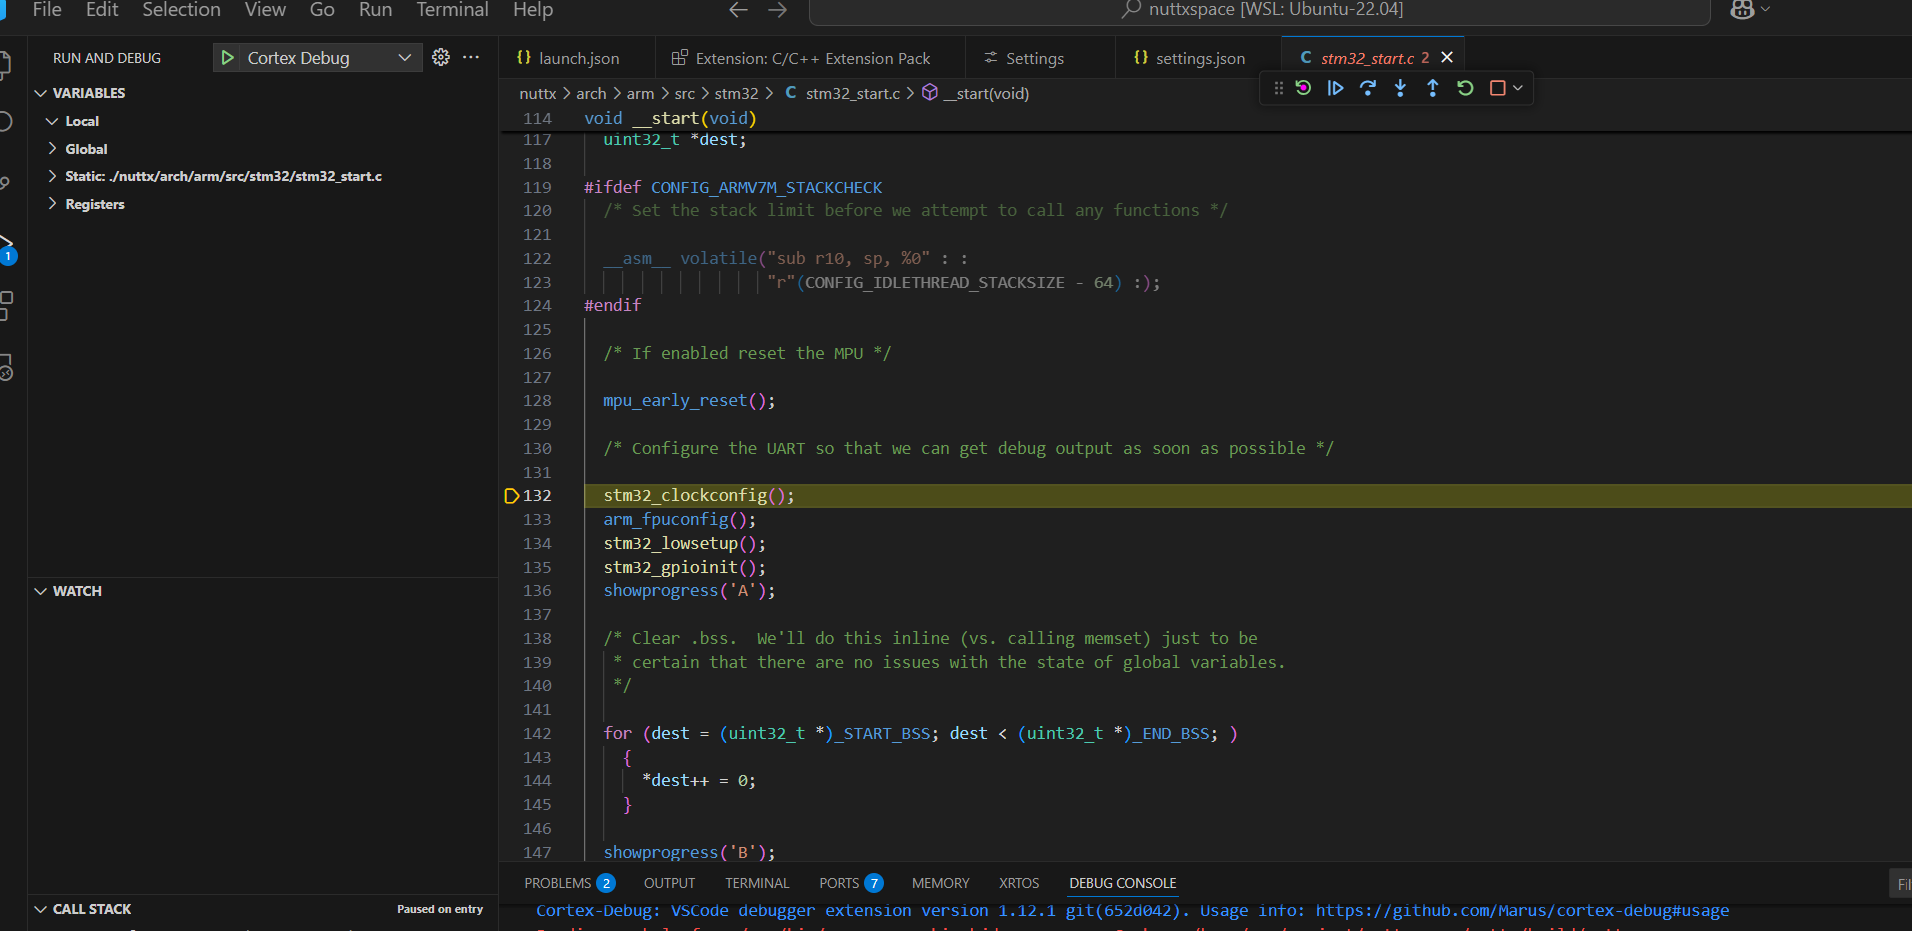
vscode中的debug配置
- 先安装cortex-debug插件.
- 再安装gdb-multiarch
- 配置debug启动
1
2
3
4
5
6
7
8
9
10
11
12
13
14
15
16
17
18
19
20
21
22
23
launch.json
{
// Use IntelliSense to learn about possible attributes.
// Hover to view descriptions of existing attributes.
// For more information, visit: https://go.microsoft.com/fwlink/?linkid=830387
"version": "0.2.0",
"configurations": [
{
"name": "Cortex Debug",
"cwd": "${workspaceFolder}",
"executable": "${workspaceFolder}/nuttx/build/nuttx",
"request": "launch",
"type": "cortex-debug",
"runToEntryPoint": "main",
"servertype": "jlink",
"ipAddress": "192.168.31.124",
"interface": "swd",
"device": "STM32F411CE"
}
]
}配置gdbserver和gdb路径
1
2
3
4
5
6
settings.json
{
"cortex-debug.gdbPath": "/usr/bin/arm-none-eabi-gdb",
"cortex-debug.JLinkGDBServerPath": "/usr/bin/JLinkGDBServerCLExe"
}保持主机的jlink remote server在开启状态。
然后启动debug,就可以调试了